
Data & Reporting

Operational data has limited value when it remains trapped in individual systems, visible only to the person who entered it. Effective reporting turns raw transactions into summaries that support scheduling decisions, resource allocation, financial review, and compliance demonstrations. Small Pea Software builds dashboards, exports, and reporting layers that give Australian organisations clear visibility into how their business is performing.

From Data Capture to Useful Insight

Reporting projects succeed when they answer questions people actually ask — not when they produce impressive charts nobody trusts. We begin by identifying those questions: What does management review each Monday? What figures does the operations lead check before approving overtime? What summary does the board request quarterly? Those conversations define metrics, dimensions, filters, and refresh expectations.

Data quality underpins every report. If source systems contain inconsistent categorisation, duplicate records, or incomplete fields, no dashboard magic fixes that. We often combine reporting delivery with data cleanup rules, validation at entry, and documented definitions so everyone interprets the same numbers the same way.

Reporting Capabilities We Provide

  • Interactive dashboards with date ranges, filters, and drill-down to underlying records where appropriate.
  • Scheduled email reports — daily summaries, weekly KPI packs, monthly management accounts support.
  • Export to CSV, Excel, and PDF for further analysis or archival.
  • Aggregations across multiple data sources when information lives in more than one system.
  • Role-based views so sensitive financial or personnel metrics are restricted appropriately.

Common Reporting Pitfalls

Scope creep appears when every stakeholder wants a different slice of data on one screen. We prioritise ruthlessly and design modular reports that can expand without collapsing under complexity. Another frequent issue is stale data — reports that refresh overnight when the business needs near-real-time visibility. We align refresh frequency with technical feasibility and cost.

Spreadsheet dependency often persists because past reports were untrusted or too slow. Rebuilding confidence requires transparent calculations, documented field mappings, and a period where new outputs are reconciled against known manual figures until stakeholders sign off.

Our Approach to Data and Reporting

We map data lineage explicitly: which table or API supplies each metric, what transformations apply, and how historical changes are handled. That documentation survives staff turnover and supports audit questions years later.

Visual design serves comprehension. We use consistent colour semantics, readable labels, and layouts that draw attention to exceptions and trends rather than decorative clutter. Mobile-friendly summary views are available where managers check figures away from their desks, though detailed analysis remains optimised for larger screens.

Performance matters at scale. As record counts grow, poorly written queries become painfully slow. We index appropriately, pre-aggregate where sensible, and test with realistic data volumes — not empty demo databases that hide problems until production.

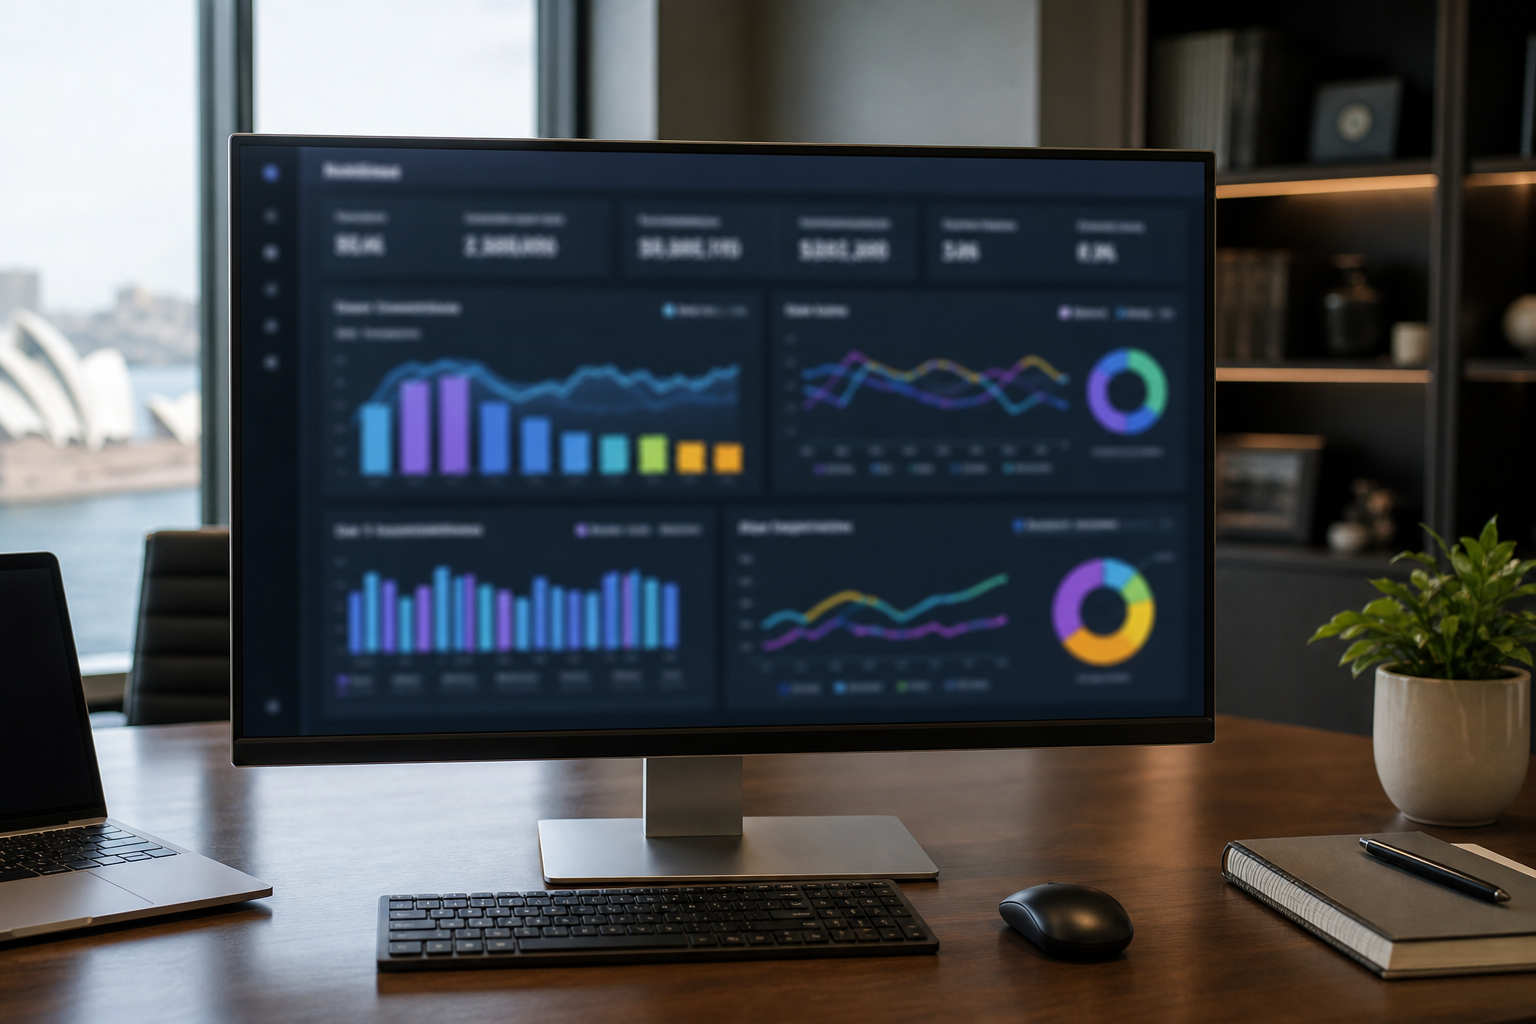
Business intelligence dashboard with operational KPIs and charts

Practical Tip: Define Metrics Before Building Screens

Write down each metric as a plain-English sentence: "Total revenue from completed jobs in the selected period, excluding cancelled orders." Note the data source, inclusion rules, and how it differs from related figures. Ambiguity discovered in a document costs minutes to resolve; ambiguity discovered after launch costs weeks of rework and eroded trust.

When to Invest in Dedicated Reporting

Invest when manual report preparation consumes hours each week, when decision-makers wait for month-end before seeing operational trends, or when compliance requires demonstrable records you cannot produce quickly from current tools. Reporting layers also make sense as a second phase after a new operational application stabilises — once clean data accumulates, visibility becomes the multiplier on that investment.

We deliver reporting as part of broader application projects or as focused engagements against existing databases and APIs. Either way, you receive artefacts you can maintain: clear queries, documented assumptions, and admin tools to adjust date boundaries or categories without developer intervention for every tweak.

Export and reporting tools for operational decision-making
Clear summaries that translate daily transactions into actionable insight.

Executive dashboards and operational dashboards serve different audiences and should not be forced into a single view. Leadership summaries emphasise trends, variance against targets, and exceptions that warrant attention — refreshed on a schedule that matches board or management rhythms. Operational screens prioritise live backlog, capacity, and same-day decisions, often with shorter refresh intervals and drill-down to individual records. Small Pea Software designs both layers from the same governed metric definitions so figures reconcile rather than compete.

Refresh service level agreements are agreed during scoping, not assumed. A nightly batch may suffice for financial roll-ups; dispatch or inventory teams may need fifteen-minute intervals or event-driven updates when source APIs permit. We document expected latency, failure behaviour when a source is unavailable, and who receives alerts when a pipeline stalls. That clarity prevents the common situation where staff assume dashboards are live when data is actually eighteen hours old.

Reconciliation with source systems is built into launch, not treated as an afterthought. During acceptance, we compare dashboard totals against known extracts from accounting, CRM, or operational databases until stakeholders sign off. Discrepancies trace back to documented transformation rules — timezone cutoffs, status filters, excluded record types — rather than unexplained rounding. That process rebuilds trust faster than any visual redesign.

Discuss Your Reporting Requirements

Share the decisions you need data to support, the systems that hold relevant information, and examples of reports you produce manually today. Small Pea Software will outline options ranging from lightweight dashboards to comprehensive reporting modules. Contact us or email support@smallpeasoftware.com.

Governance, SLAs, and Dashboard Layers

Reliable reporting depends on metric governance — a shared register that defines each figure in plain language, names the authoritative source, and records who may approve changes. Without that register, departments invent parallel definitions and leadership debates consume meetings that dashboards were meant to shorten. Small Pea Software establishes governance early: a living document linked to report screens so anyone viewing a KPI can see how it is calculated.

Refresh SLAs and Source Reconciliation

Every data pipeline receives an agreed refresh SLA stating maximum age of displayed data, monitoring expectations, and escalation when jobs fail. Pipelines that feed executive packs may tolerate longer windows; operational views tied to scheduling or fulfilment need tighter bounds. Reconciliation checks run automatically where practical — comparing row counts and key totals against source extracts — with variance thresholds that trigger review before incorrect figures reach decision-makers.

  • Metric owner — business contact accountable for definition and sign-off when logic changes.
  • Refresh SLA — documented maximum data age per report or dashboard layer.
  • Reconciliation rule — how totals are verified against source systems and tolerated variance.
  • Executive layer — trend-focused summaries for leadership with controlled drill-down.
  • Operational layer — near-real-time views for day-to-day staff with record-level detail.
A metric without an owner, a refresh promise, and a reconciliation path is a number waiting to be challenged — usually at the worst possible moment.

Practical Tip: Separate Executive and Operational Views

Resist combining board-level KPIs and dispatch-floor detail on one screen. Executives need signal without noise; operators need immediacy without wading through rolled-up aggregates. Shared definitions underneath both layers keep numbers aligned while interfaces match how each audience actually works.