June 2026
Dashboards fail when they answer questions nobody asks on a Tuesday morning. Operational reporting succeeds when it aligns with decisions managers make daily: which jobs are at risk, where backlog is building, which sites missed SLA targets, and whether yesterday's exceptions were resolved. Pretty charts are optional; trustworthy numbers are not.
Start With Decisions, Not Data Sources
We begin reporting engagements by listing decisions, not tables. For a regional services operator, decisions might include reallocating crews, approving overtime, escalating a client complaint, or pausing new intake until backlog clears. Each decision maps to metrics, thresholds, and drill-down paths. Without that mapping, BI projects produce impressive wallboards that staff glance at once and ignore.
Operational reporting differs from financial reporting in tempo and tolerance for estimation. Finance needs closed periods and audited totals. Operations needs near-real-time signals with clear definitions of "open," "in progress," and "complete." Mixing the two without labelling creates arguments in leadership meetings when dashboard job counts do not match invoice lines.
Australian businesses spanning multiple time zones and public holidays must define cutoffs explicitly. A job completed at 11:50 pm in Perth may fall into a different reporting day than Sydney leadership expects. Document timezone handling, business-day rules, and whether metrics use created date, scheduled date, or completion timestamp.

Make Definitions Visible
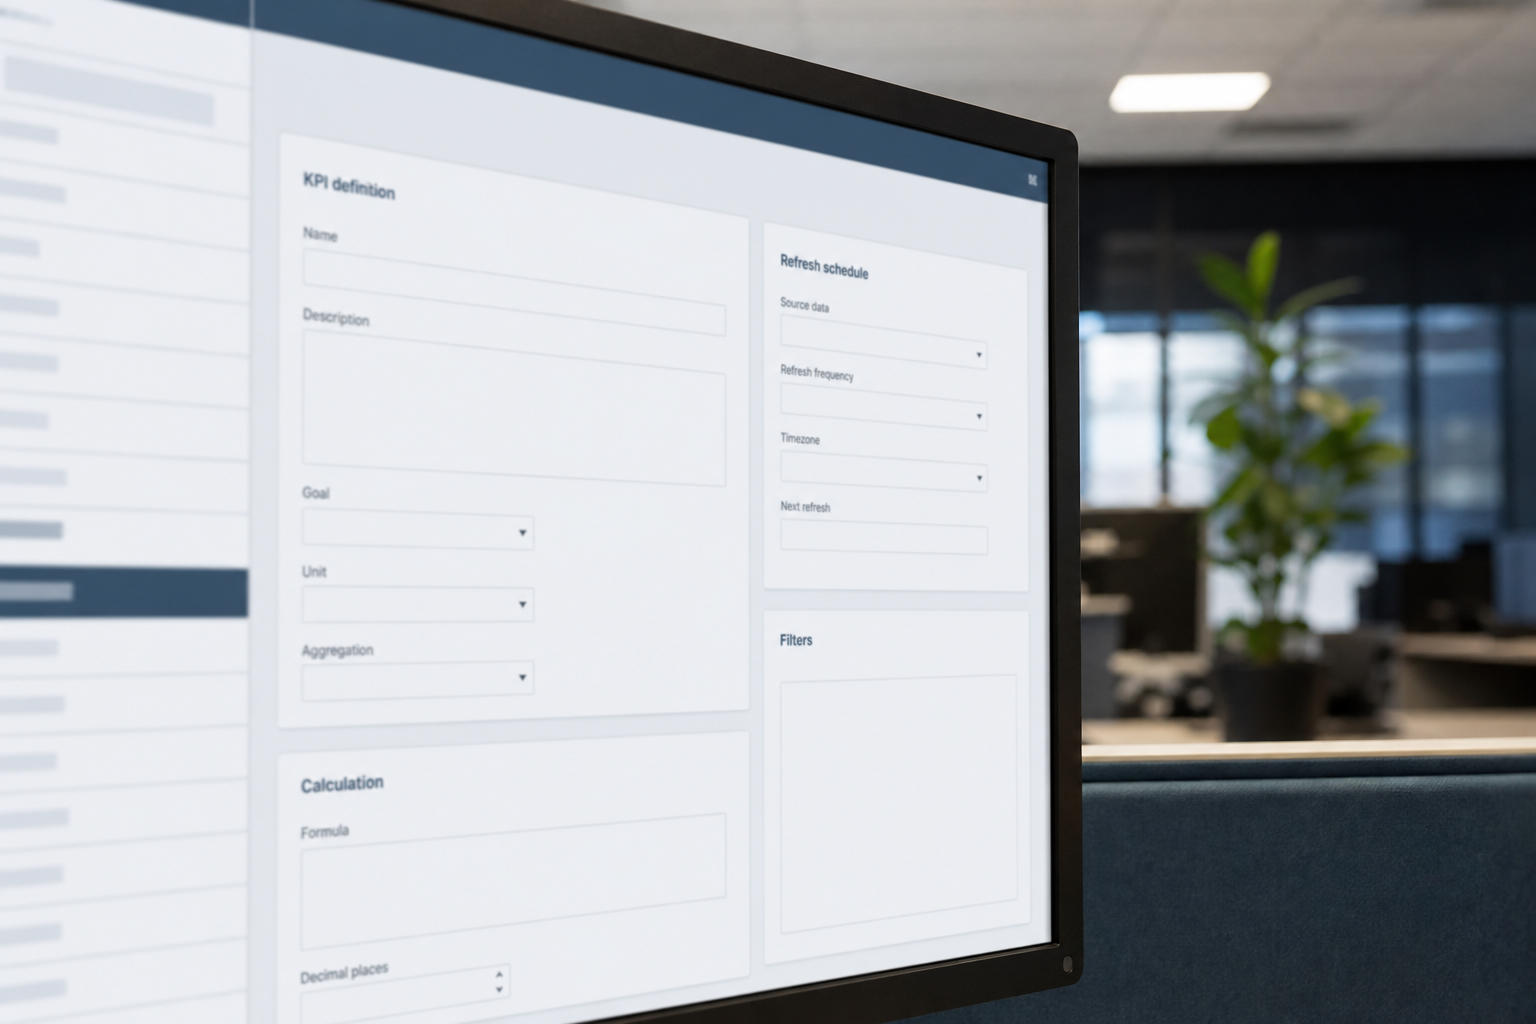
Managers distrust reports they cannot explain to their own teams. Every KPI should have an inline definition accessible from the dashboard: numerator, denominator, inclusion rules, and refresh frequency. When definitions live only in a data warehouse document nobody opens, staff invent their own interpretations and parallel spreadsheets return.
Small Pea Software embeds metadata in operational portals so site managers see the same figures their regional lead sees, filtered appropriately by role. Row-level security is not optional when reports include client names, pricing, or workforce performance. Export controls matter too — a CSV emailed externally can undermine confidentiality faster than a misconfigured screen.
Compare reports against ground truth during design. Pick ten known scenarios — a cancelled job, a split invoice, a rework visit — and verify the dashboard reflects reality. Reconciliation tests become regression fixtures when logic changes. This discipline prevents silent drift that erodes trust over quarters.
Reporting Capabilities Worth Prioritising
- Exception queues sorted by age and business impact, not alphabetically by client.
- Trend lines with comparable periods that respect seasonality in Australian operations.
- Drill-down from region to site to individual job without exporting to Excel.
- Scheduled PDF or email summaries for leaders who will not log into another system.
A dashboard everyone ignores is more dangerous than no dashboard — it creates false confidence while decisions still happen in inbox threads.
Integrate Reporting Into Workflow
Reporting improves when it sits adjacent to action. If a metric shows rising overdue approvals, the user should jump directly to the queue and resolve items — not copy numbers into a separate task list. We design operational portals where charts link to filtered worklists, assignment tools, and comment threads. Closing the loop increases adoption more than any chart redesign.
Exports remain necessary for board packs, regulator submissions, and ad-hoc analysis. Provide stable export formats with column dictionaries. Sudden column renames break client macros and finance models. Version export layouts when change is unavoidable and communicate deprecations.
Performance matters for adoption. Dashboards that spin for thirty seconds during morning stand-ups will be abandoned. Pre-aggregate where appropriate, cache expensive queries, and load critical tiles first. Mobile-friendly layouts help field supervisors who will never sit at a desktop — but prioritise clarity over cramming every KPI onto a phone screen.
Govern Metrics Over Time
Operational definitions evolve as the business changes. Introduce a lightweight governance cadence: metric owners, change logs, and approval for definition shifts that affect bonuses or compliance. Without governance, a well-meaning developer "fixes" a calculation and accidentally alters a year's trend comparison.
When reporting is treated as a product with owners, refresh cycles, and user feedback, managers stop maintaining shadow reports. They ask better questions because the system answers the ones that matter. If your current dashboards are admired but unused, revisit the decisions they were meant to support — then rebuild from there.
Adoption metrics deserve the same attention as query performance. Track how often leaders open dashboards, how frequently they drill into worklists, and whether exported CSVs still circulate after go-live. A beautiful report that nobody acts on is a signal to reconnect metrics to decisions — not to add more charts.